Linux Kernel Perf CVE-2023-5717 Quick Analysis
CVE-2023-5717 is a vulnerability in the Linux perf subsystem. Currently, I have not been eabled to find a PoC for this vulnerability. According to the CVE description and the commit log, the root cause of the vulnerability is the inconsistency between parent and child events, which can lead to an out-of-bounds write.
1. Patch
After applying the patch, kernel updates group_generation field during event inheriting (inherit_group()), attaching (perf_group_attach()) and detaching (perf_group_detach()) events.
When reading data from a group leader, the function __perf_read_group_add() is called. This function ensures the following conditions are met:
parent->group_generation==leader->group_generationparent->nr_siblings==leader->nr_siblings
The patch for this part is as follows:
@@ -5450,6 +5452,33 @@ static int __perf_read_group_add(struct perf_event *leader,
         return ret;

     raw_spin_lock_irqsave(&ctx->lock, flags);
+    /*
+    * [...]
+     */
+    parent = leader->parent;
+    if (parent &&
+        (parent->group_generation != leader->group_generation ||
+         parent->nr_siblings != leader->nr_siblings)) {
+        ret = -ECHILD;
+        goto unlock;
+    }
    // [...]
If either condition is not satisfied, the function returns the ECHILD error code, indicating “No child processes”.
2. Inherited Event
A process with perf events will inherit event contexts in its child processes during sys_fork. There are two types of contexts: hardware and software.
static __latent_entropy struct task_struct *copy_process(
                    struct pid *pid,
                    int trace,
                    int node,
                    struct kernel_clone_args *args)
{
    // [...]
    retval = perf_event_init_task(p, clone_flags);
    // [...]
}

int perf_event_init_task(struct task_struct *child, u64 clone_flags)
{
    // [...]
    for_each_task_context_nr(ctxn) {
        ret = perf_event_init_context(child, ctxn, clone_flags);
    }
}

#define for_each_task_context_nr(ctxn)                    \
    for ((ctxn) = 0; (ctxn) < perf_nr_task_contexts; (ctxn)++)

enum perf_event_task_context {
    perf_invalid_context = -1,
    perf_hw_context = 0,
    perf_sw_context,
    perf_nr_task_contexts,
};
The function find_get_context() is called to create a new context during sys_perf_event_open. The type of context depends on which PMU is used [1].
static struct perf_event_context *
find_get_context(struct pmu *pmu, struct task_struct *task,
        struct perf_event *event)
{
    // [...]
    ctxn = pmu->task_ctx_nr; // [1]

    // [...]
    ctx = perf_lock_task_context(task, ctxn, &flags);
    if (ctx) {
        // [...]
    } else {
        ctx = alloc_perf_context(pmu, task);
        // [...]
        else {
            get_ctx(ctx);
            ++ctx->pin_count;
            rcu_assign_pointer(task->perf_event_ctxp[ctxn], ctx);
        }
    }
}
The perf_event_init_context() function begins by updating pin_count and refcount [2]. Subsequently, it iterates through pinned_groups [3] and flexible_groups [4] to handle event inheritance.
static int perf_event_init_context(struct task_struct *child, int ctxn,
                   u64 clone_flags)
{
    if (likely(!parent->perf_event_ctxp[ctxn]))
        return 0;

    parent_ctx = perf_pin_task_context(parent, ctxn /* 0 for hw, 1 for sw */); // [2]

    // [...]
    perf_event_groups_for_each(event, &parent_ctx->pinned_groups) { // [3]
        ret = inherit_task_group(event, parent, parent_ctx,
                     child, ctxn, clone_flags,
                     &inherited_all);
    }

    // [...]
    perf_event_groups_for_each(event, &parent_ctx->flexible_groups) { // [4]
        ret = inherit_task_group(event, parent, parent_ctx,
                     child, ctxn, clone_flags,
                     &inherited_all);
    }

    // [...]
    child_ctx->parent_ctx = parent_ctx;
}
An event belongs to either pinned_groups or flexible_groups is determined by attributes pinned during the creation of a new group leader event.
static struct perf_event_groups *
get_event_groups(struct perf_event *event, struct perf_event_context *ctx)
{
    if (event->attr.pinned)
        return &ctx->pinned_groups;
    else
        return &ctx->flexible_groups;
}
The inherit_task_group() function is responsible for allocating a new perf context for a child process [5]. It then calls inherit_group() to inherit an event group [6].
static int
inherit_task_group(struct perf_event *event, struct task_struct *parent,
           struct perf_event_context *parent_ctx,
           struct task_struct *child, int ctxn,
           u64 clone_flags, int *inherited_all)
{
    if (!event->attr.inherit || /* ... */) {
        *inherited_all = 0;
        return 0;
    }

    child_ctx = child->perf_event_ctxp[ctxn];
    if (!child_ctx) {
        child_ctx = alloc_perf_context(parent_ctx->pmu, child); // [5]
        child->perf_event_ctxp[ctxn] = child_ctx;
    }

    // [...]
    ret = inherit_group(event, parent, parent_ctx, // [6]
                child, child_ctx);

    // [...]
}
The inherit_group() function attempts to replicate a perf state. It begins by inheriting the group leader [7] and subsequently inherits all the group members [8].
static int inherit_group(struct perf_event *parent_event,
          struct task_struct *parent,
          struct perf_event_context *parent_ctx,
          struct task_struct *child,
          struct perf_event_context *child_ctx)
{
    struct perf_event *leader;
    struct perf_event *sub;
    struct perf_event *child_ctr;

    leader = inherit_event(parent_event, parent, parent_ctx, // [7]
                 child, NULL, child_ctx);

    for_each_sibling_event(sub, parent_event) {
        child_ctr = inherit_event(sub, parent, parent_ctx, // [8]
                        child, leader, child_ctx);
        // [...]
    }
    // [...]
}
To prevent the creation of recursive event hierarchies, the inherit_event() function ensures all events are inherited back to the original parent [9]. It then allocates and initializes a new perf event, such as calculating read_size [10].
static struct perf_event *
inherit_event(struct perf_event *parent_event,
          struct task_struct *parent,
          struct perf_event_context *parent_ctx,
          struct task_struct *child,
          struct perf_event *group_leader,
          struct perf_event_context *child_ctx)
{
    // [...]
    if (parent_event->parent)
        parent_event = parent_event->parent; // [9]

    child_event = perf_event_alloc(&parent_event->attr,
                       parent_event->cpu,
                       child,
                       group_leader, parent_event,
                       NULL, NULL, -1);
    child_event->ctx = child_ctx;
    // [...]

    perf_event__header_size(child_event); // [10]
    add_event_to_ctx(child_event, child_ctx);
    list_add_tail(&child_event->child_list, &parent_event->child_list);
}
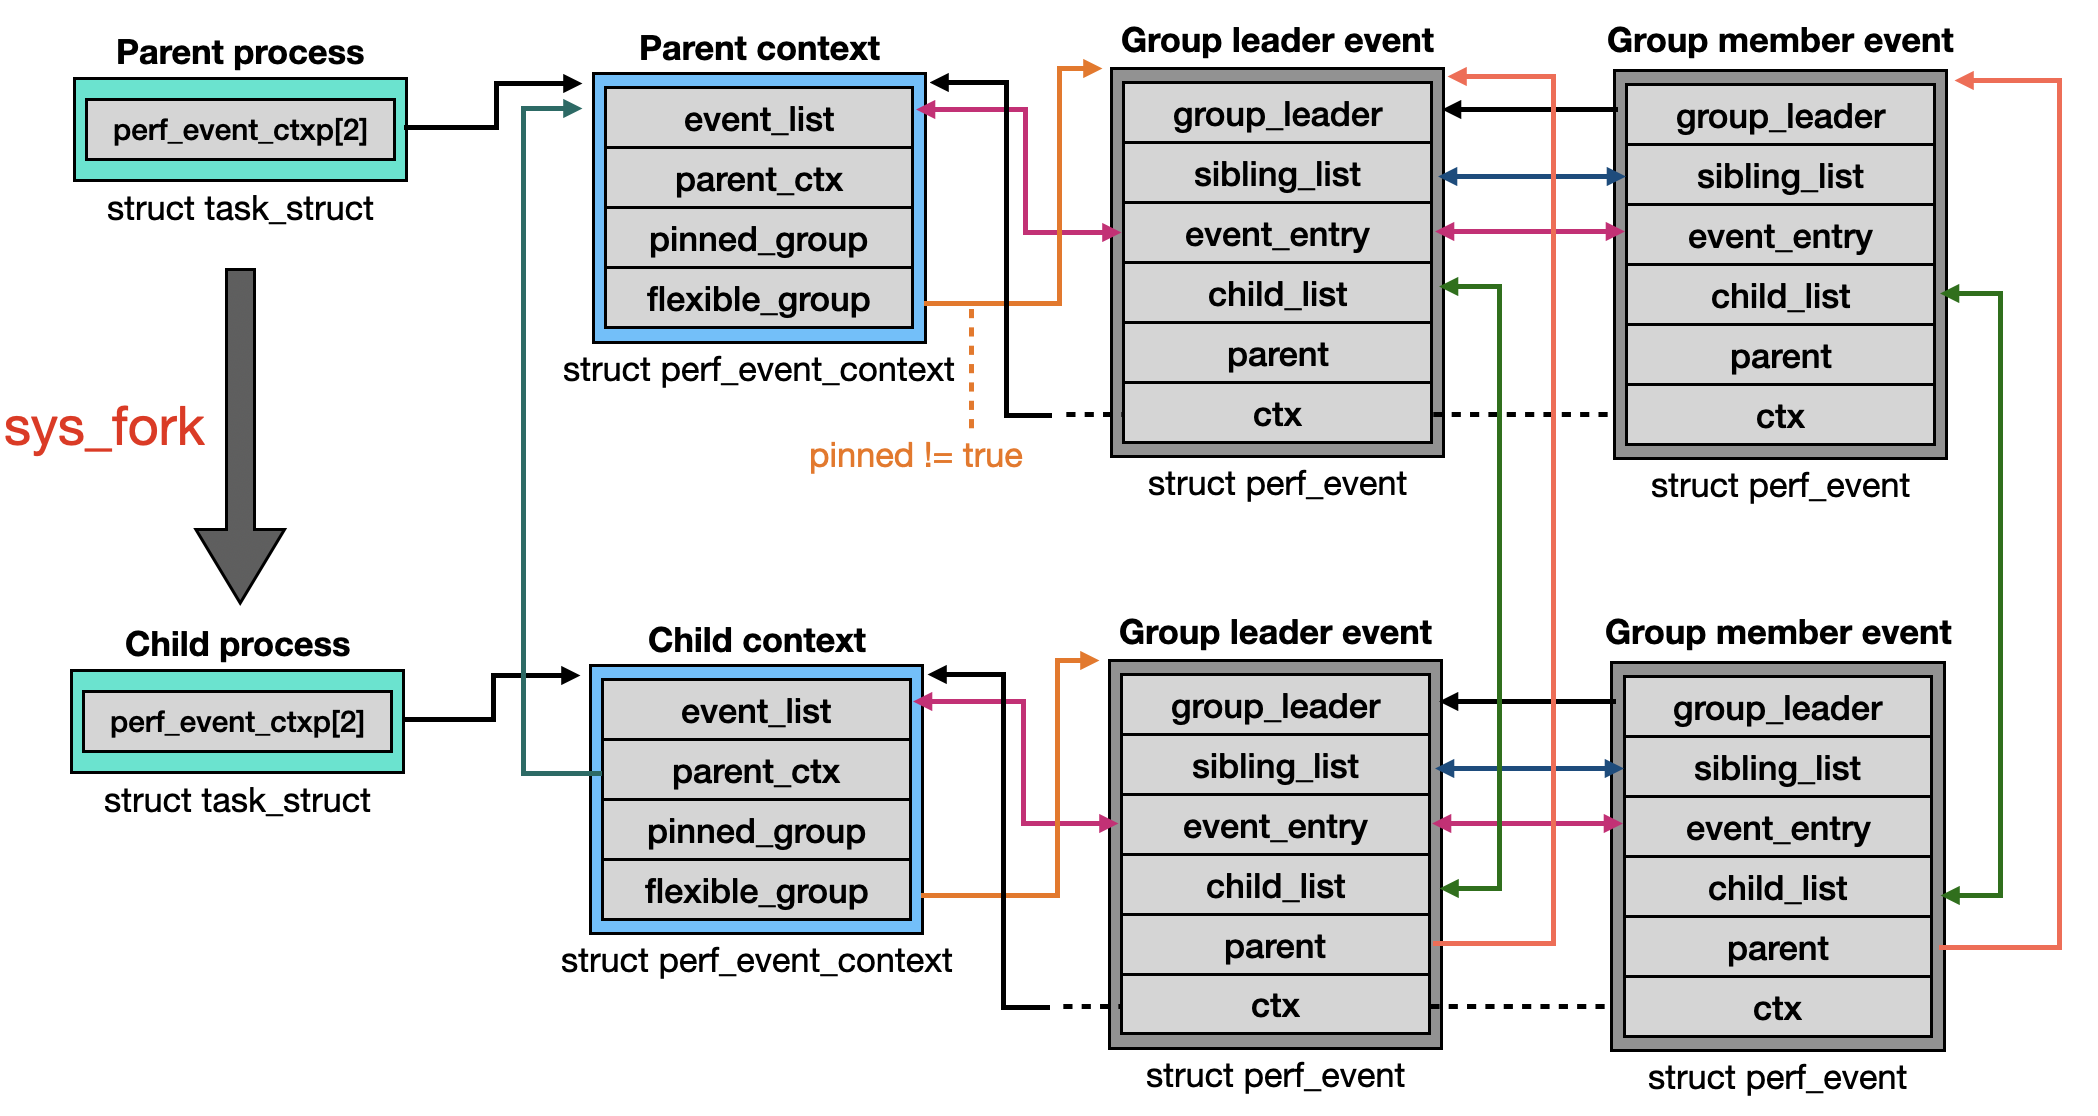
The diagram below illustrates the relationship between parent, child, group leader, and sibling events.

3. Root Cause
When a process reads data from the group leader event, the perf_read_group() function is invoked. The buffer size is determined by event->read_size [1]. This function first reads the events within the same group [2] and then iterates through the child events [3].
static int perf_read_group(struct perf_event *event,
                   u64 read_format, char __user *buf)
{
    struct perf_event *leader = event->group_leader, *child;
    struct perf_event_context *ctx = leader->ctx;
    int ret;
    u64 *values;

    lockdep_assert_held(&ctx->mutex);

    values = kzalloc(event->read_size, GFP_KERNEL); // [1]
    // [...]

    ret = __perf_read_group_add(leader, read_format, values); // [2]

    list_for_each_entry(child, &leader->child_list, child_list) { // [3]
        ret = __perf_read_group_add(child, read_format, values);
        if (ret)
            goto unlock;
    }
}
The __perf_read_group_add() function not only reads data from itself but also iterates through all events in the same group.
static int __perf_read_group_add(struct perf_event *leader,
                    u64 read_format, u64 *values)
{
    // [...]
    for_each_sibling_event(sub, leader) {
        values[n++] += perf_event_count(sub);
    }
}
When closing a perf event, perf_release() is called.
static const struct file_operations perf_fops = {
    // [...]
    .release        = perf_release,
    // [...]
};

static int perf_release(struct inode *inode, struct file *file)
{
    perf_event_release_kernel(file->private_data);
    return 0;
}
The function perf_event_release_kernel() is called internally. It first acquires the lock of the context [4], then detaches itself from the context [5] , and finally detaches its child events [6].
int perf_event_release_kernel(struct perf_event *event)
{
    ctx = perf_event_ctx_lock(event); // [4]
    perf_remove_from_context(event, DETACH_GROUP|DETACH_DEAD); // [5]

    // [...]
    list_for_each_entry(child, &event->child_list, child_list) { // [6]
        // [...]
        perf_remove_from_context(child, DETACH_GROUP);
        // [...]
    }
}
Because the flags parameter passed to perf_remove_from_context() includes DETACH_DEAD, the kernel invokes perf_group_detach() to remove the event from its group [7].
static void perf_remove_from_context(struct perf_event *event, unsigned long flags)
{
    struct perf_event_context *ctx = event->ctx;
    lockdep_assert_held(&ctx->mutex);

    // [...]
    __perf_remove_from_context(event, __get_cpu_context(ctx),
                       ctx, (void *)flags);
}

static void
__perf_remove_from_context(struct perf_event *event,
               struct perf_cpu_context *cpuctx,
               struct perf_event_context *ctx,
               void *info)
{
    // [...]

    if (flags & DETACH_GROUP)
        perf_group_detach(event); // [7]

    // [...]
}
The perf_group_detach() function unlinks the event from the sibling_list [8] and recalculates the read_size of the group leader [9].
static void perf_group_detach(struct perf_event *event)
{
    // [...]

    if (leader != event) {
        list_del_init(&event->sibling_list); // [8]
        event->group_leader->nr_siblings--;
        goto out;
    }

    // [...]
out:
    perf_event__header_size(leader); // [9]
}
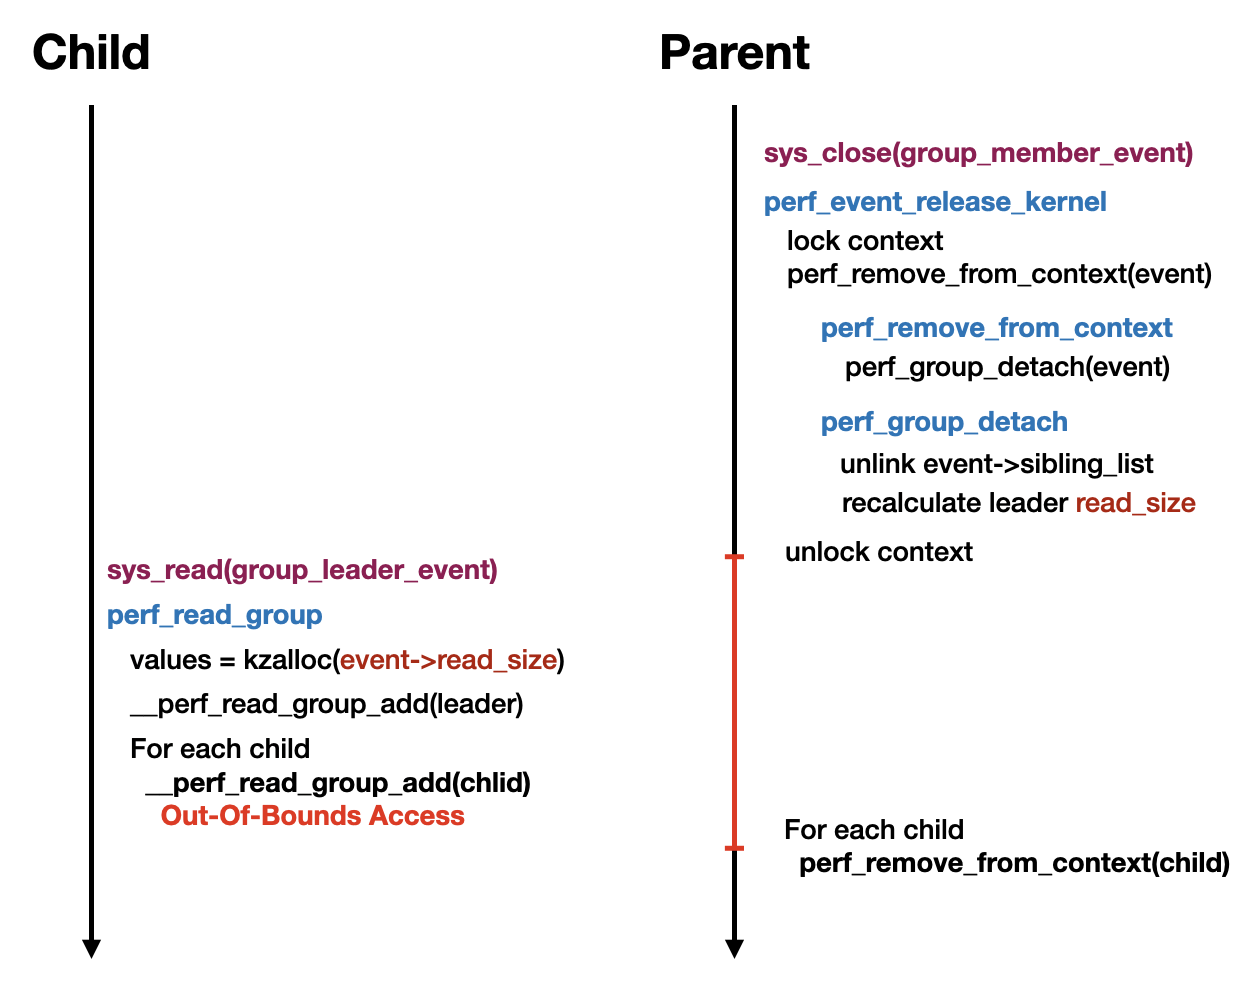
After the parent process detaches an event from the group (sibling), but before it detaches the children of the event (child), a time window exists where a nr_siblings mismatch occurs between the parent group and the child group.
If the sibling counts between the parent group and the child group differ, an out-of-bounds write can take place when the __perf_read_group_add() function iterates through the sibling events.
