Learning Protocol Handler
0. Murmur
It has been four months since I last wrote a post… pretty long, lol. The reason is not only that I took a longer break after a whole busy year, like playing the game, doing more exercise, and thinking about the meaning of life, but also that I tried to step out of my comfort zone (in every aspect).
At the end of October, I randomly asked Faith (@farazsth98) if he wanted to participate in the first-year zeroday.cloud competition, and maybe we could team up to target Ubuntu. I viewed it as a side project to push myself to do more research on the Linux kernel, and I also wanted to know what it’s like to do research with researchers more senior than me. However, I didn’t expect things to turn out like that. It only took us about three weeks – from finding some unused bugs and one exploitable vulnerability to finishing the exploitation – which is crazy and unimaginable. After that, we spent some time optimizing it, and in the end, we successfully archived LPE on latest Ubuntu Server!
This journey sounds great and should have made me even more passionate about security research, right? But after coming back from Landon (zeroday.cloud was held with BHEU, which was in Landon), I felt burned out and had no energy to read code for no reason. I started thinking about why I do security research and what I am actually chasing. The bad feeling lasted for three weeks. During this period, I read blogs (not limited to security) and did some non-heavy work, like organizing notes. In my free time, I spent more time thinking about what I was stuck on. As I read more and thought more, I gradually found my passion back, because I could see the enjoyment of sharing in those posts. They were pure happiness, learning new things, sharing cool techniques and stuff like that, and that was what I had lost.
Now, I still have a big project on Linux kernel research, but I also read blogs and do research in areas that I am not familiar with, just for fun. That’s why there were no post on the blog for months, and why this new post is about web security.
I am neither an expert in web security nor someone with deep research experience in protocol handlers. As a result, I will only provide an overview of protocol handlers along with some of my research notes.
I also want to thank maple (@maple3142) for answering my question and sharing his knowledge!
1. Introduction
If you click a link that looks like "XXXX://" – where XXXX is not a common protocol such as http and https – you may see a prompt on the screen asking whether you allow a specific program to open it. For example, if I try to navigate slack://XXXX in Safari, macOS will ask me: “do you allow this website to open Slack”? The “Slack” here is the specific program I mentioned earlier.

The protocol handler describes the situation in which user clicks a custom procol link and then operating system attempts to forward the URL request to the corresponding program. On different operating systems, the relationship between a protocol and a program is defined in different ways.
On macOS, this relationship is defined in the file ~/Library/Preferences/com.apple.LaunchServices/com.apple.launchservices.secure.plist, which is also the preference file for the domain com.apple.launchservices.secure. You can easily read it in a human-readable format using the command defaults read <domain>.
$ defaults read com.apple.LaunchServices/com.apple.launchservices.secure
{
    LSHandlers =     (
                {
            LSHandlerModificationDate = 0;
            LSHandlerPreferredVersions =             {
                LSHandlerRoleAll = "-";
            };
            LSHandlerRoleAll = "com.apple.gamecenter.gamecenteruiservice";
            LSHandlerURLScheme = "itms-gcs";
        },
        ...
    );
}
On Windows, protocol handlers are defined in the registry, with the following format:
HKEY_CLASSES_ROOT\<protocol_name>\shell\open\command
In my Windows VM, the handler for vscode:// is Code.exe as shown in the screenshot below:

On Linux, different distributions may use different mechanisms, so here I will take Ubuntu as an example. On Ubuntu, there is another concept called MIME types (Media Types). MIME types are used to identify file types and determine which applications should open them by default. You can use the following commands to find MIME handlers:
# for per-user
grep -ir "MimeType=x-scheme-handler" ~/.local/share/applications/
# for system
grep -ir "MimeType=x-scheme-handler" /usr/share/applications/
You will see file content like the following:
MimeType=x-scheme-handler/XXXXX
Here, XXXXX is protocol name. By opening the corresponding configuration file, you can further identify the program and the command format associated with that protocol. For example, the description of the protocol snap:// is defined in /usr/share/applications/snap-handle-link.desktop. By reading the file, you can know that its handler is program /usr/bin/snap.
[Desktop Entry]
...
Exec=/usr/bin/snap handle-link %U
MimeType=x-scheme-handler/snap;
...
2. Electron
As its documentation described, Electron is a framework for building desktop applications using JavaScript, HTML, and CSS, and it embeds Chromium and Node.js into its binary. By using Electron, you only need to maintain one JS codebase to create cross-platform apps that work on Windows, macOS, and Linux!
A diagram from Advanced Electron.js architecture clearly shows the architecture of Electron.
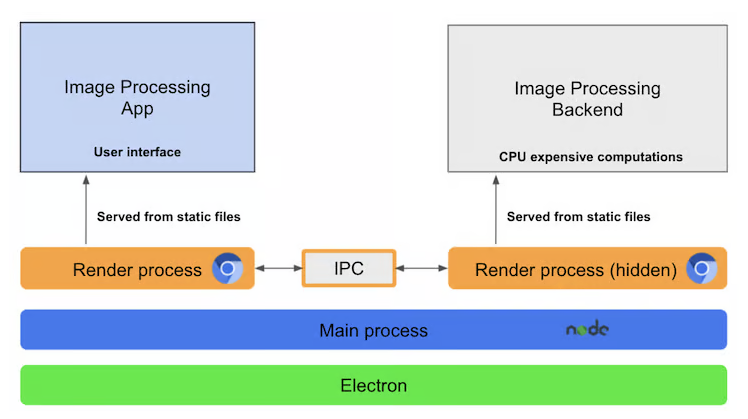
The main process (blue one) of Electron is Node.js, which provides delevopers with abundant APIs to use. If you have some knowledge of Chrome, I think its role is similar to the browser process, handling those requests that require high privileges from render processes.
The renderer process runs inside Chromium, and it is responsible for rendering web pages by parsing HTML and CSS and running Javascript. Since Electron is used to build applications, it can be imagined that each application needs to control how the web pages are rendered and behave.
Electron exposes many JavaScript APIs that allow developers to hook into. When starting an application, a main script will be executed by Node.js (main process) to set up the environment. Later, when Chromium is loaded, the browser context has already been configured with application-specific behaviors.
One of the features Electron supports is custom protocol handling. By using the API app.setAsDefaultProtocolClient(), you can register an application as the handler of a specific protocol. For example, if I want to register my application to be the myapp:// protocol handler, I can run the following JS code in the main script:
if (!app.isDefaultProtocolClient('myapp')) {
    app.setAsDefaultProtocolClient('myapp')
}
On Windows and Linux, you can write code like the following to handle startup requests triggered by a deeplink:
app.whenReady().then(() => {
  const url = process.argv.find(arg => arg.startsWith('myapp://'))
  if (url) {
    // ...
  }
})
Instead of handling requests inside the app.whenReady() callback, on macOS you must define an 'open-url' event handler:
app.on('open-url', (event, url) => {
  // ...
})
If a deeplink is triggered from within the application or from a browser while an existing instance is already running, Electron (which typically allows only a single application process) will first launch a second instance. This second instance sends a 'second-instance' event to the main instance and then exits. As a result, you may need to define a 'second-instance' event handler to handle this scenario.
app.on('second-instance', (event, argv) => {
  const url = argv.find(arg => arg.startsWith('myapp://'))
  if (url) {
    // ...
  }
})
3. Obsidian
3.1. File Extraction
Obsidian is a free note-taking app based on Electron (btw, I’ve used this app to take research notes for two years, so you should give it a try!).
After installation, it registers the obsidian:// protocol handler, which invokes Obsidian.exe to handle the URL requests.

Obsidian is not an open-source project, but you can download its ASAR file from the GitHub release. ASAR (Atom Shell Archive) is a file format used by Electron to package applications. This file is generated by the asar Node.js package, and you can use the extract command to unpack it.
npx asar extract obsidian-1.11.4.asar out
Once the obsidian-XXXX.asar is extracted, you will find the following files:
$ tree -L 1
.
...
├── app.js
..
├── main.js
├── package.json
...
└── worker.js
The attribute "main" in package.json defines which JS file is executed first. However, index.js is missing from the extracted directory. Why?
{
    ...
    "main": "index.js",
    ...
}
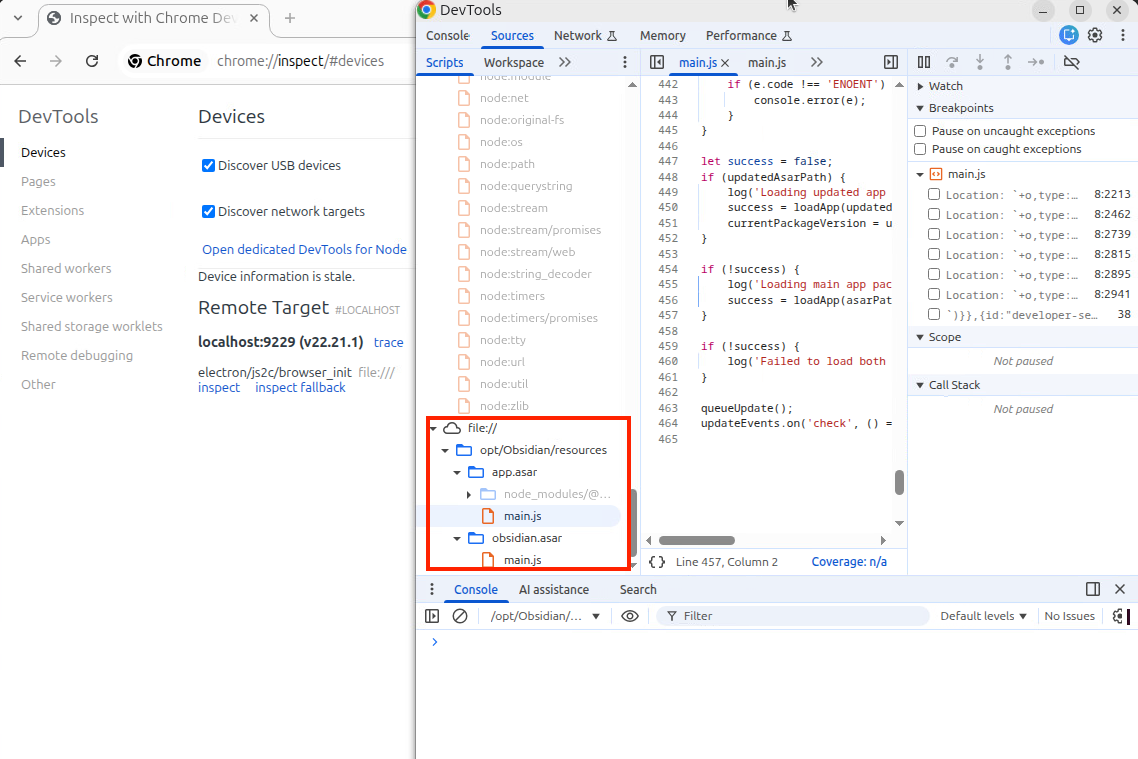
If you directly install Obsidian from the released .deb package on Ubuntu (my VM is Ubuntu haha), you’ll find that /opt/Obsidian/resources contains not only obsidian.asar but also app.asar.
aaa@aaa:~$ ls -al /opt/Obsidian/resources
...
-rw-rw-r-- 1 root root    86730 Jan 12 22:46 app.asar
...
-rwxrwxr-x 1 root root 25878062 Jan 12 22:46 obsidian.asar
According to the Electron source code and related posts, it appears that the archive named app.asar is the one actually loaded. Inside app.asar, the package.json file defines main.js as the main JS script.
{
    ...
    "main": "main.js",
    ...
}
Its content looks more like what I would expect from the entry point of an Electron application. By reading the code, we can also see that obsidian.asar is loaded after the first stage of initialization.
let asarPath = path.join(APP_PATH, 'obsidian.asar');

// [...]

function loadApp(asarPath) {
    // Execute asar content
    let main = path.join(asarPath, 'main.js');

    let fn;
    try {
        fn = require(main);
    } catch (e) {
        return false;
    }

    if (fn) {
        fn(asarPath, updateEvents);
        return true;
    }
    return false;
}

// [...]

if (!success) {
    log('Loading main app package', asarPath);
    success = loadApp(asarPath);
}
3.2. Debugging
3.2.1. Runtime Patch
Here I want to share how I debug Obsidian. To be honest, this is also the main reason why I wrote this post. It includes the basic Electron application debugging (which I didn’t know before) and runtime patches to enable Obsidian’s inspector.
Normally, an Electron application supports two ways to debug: DevTools and Inspector. I believe everyone has used DevTools before, but you may not expect that it is also embedded inside an Electron app.
For Obsidian, you can use the shortcut option + command + I on macOS or shift + control + I on Ubuntu to open the DevTools.
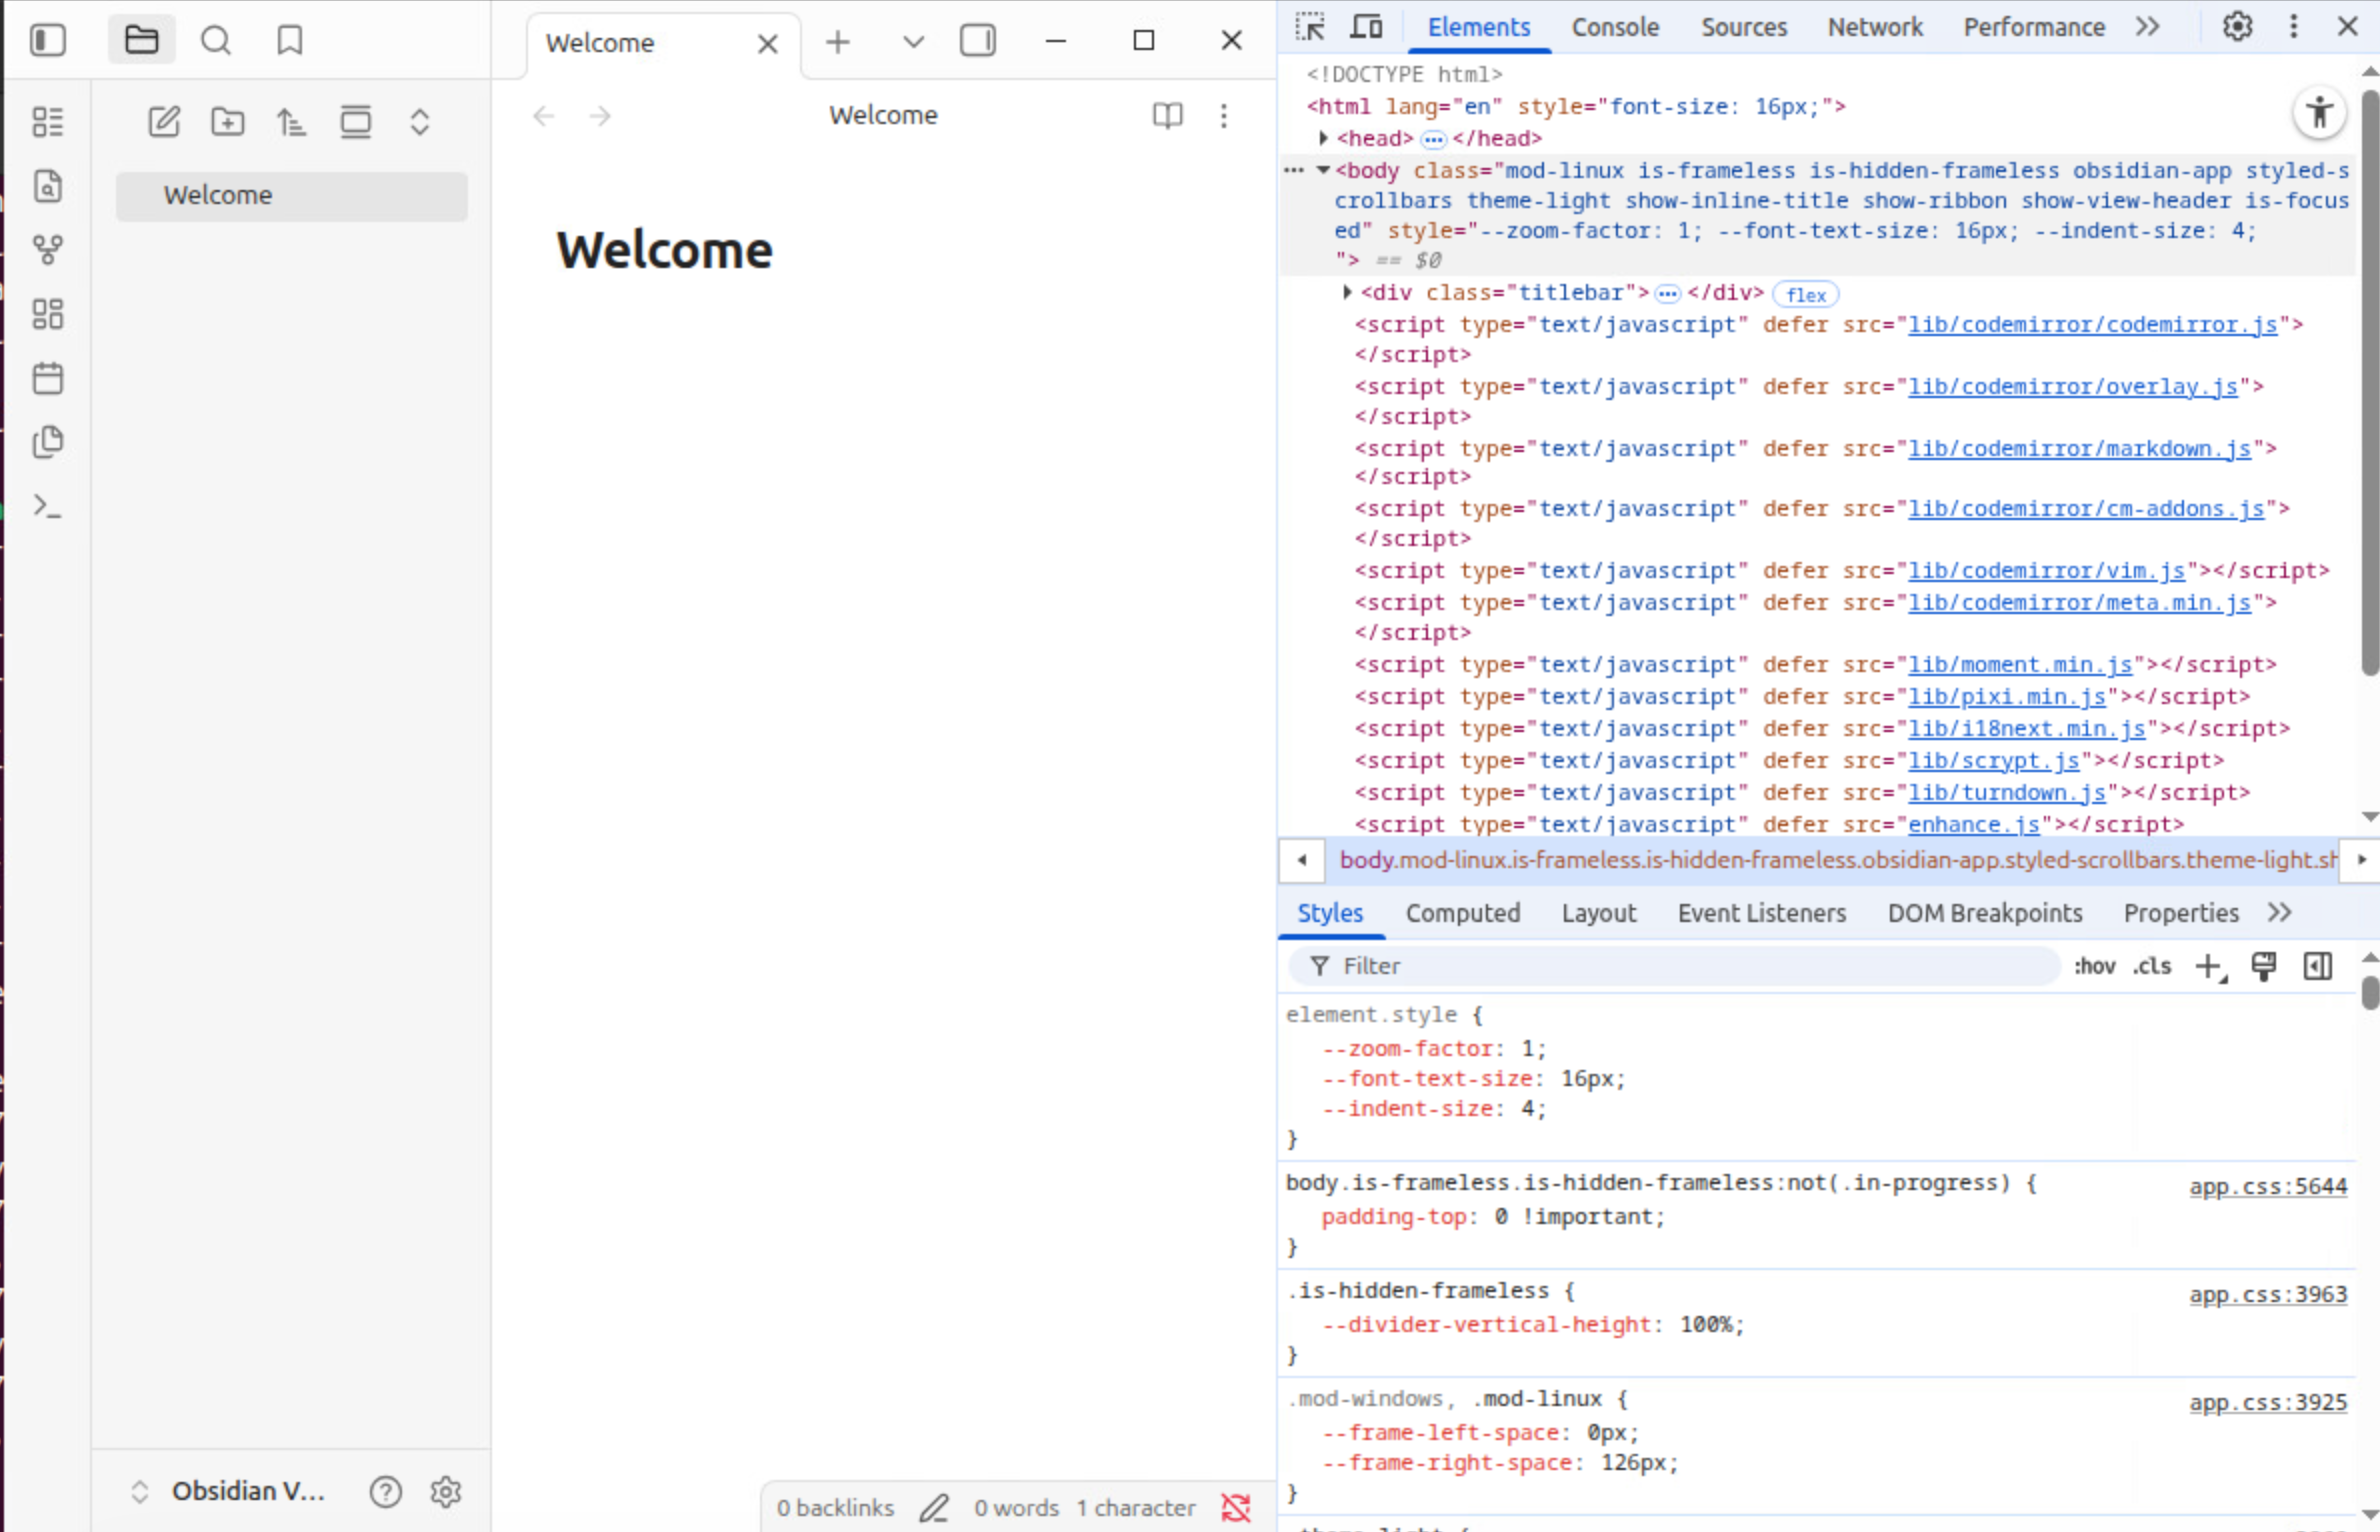
By opening the sources tab, you can see which code is executed on this page. You can also set breakpoints and debug it directly.
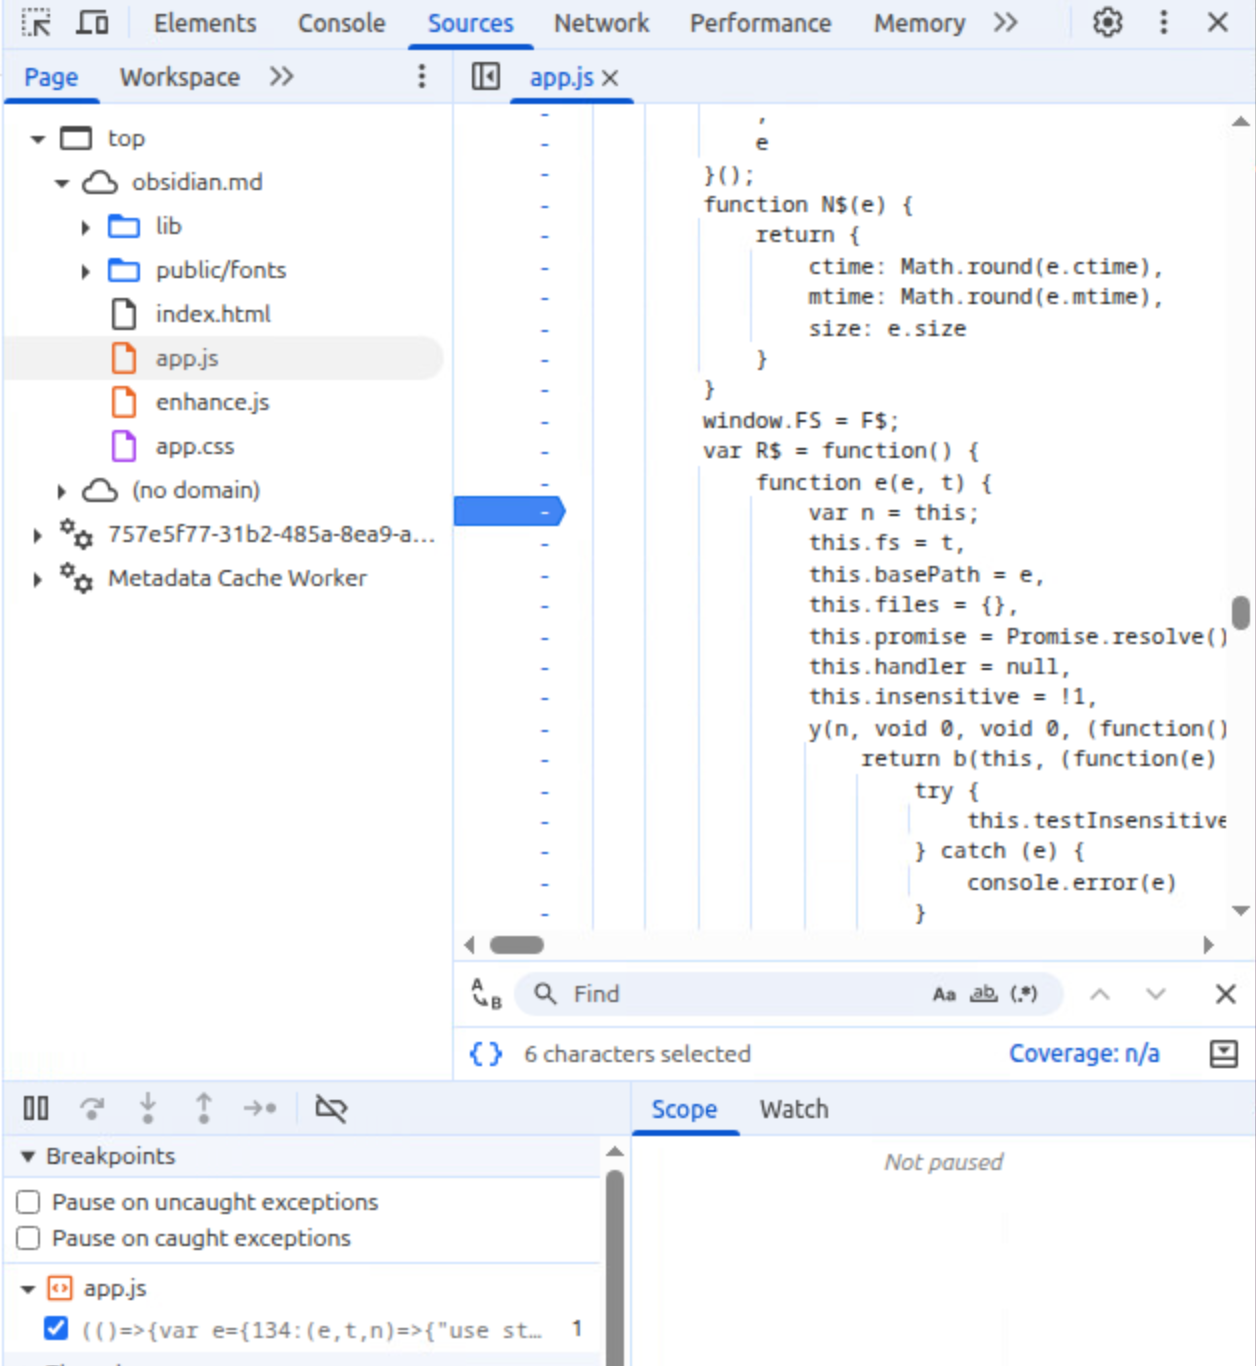
It is straightforward, right? However, this only debugs the current page running in the renderer process. What about the main process, which is the Node.js process? That is where the second method comes in: Inspector.
If we mirror its role into gdb toolchain, Inspector is more like the gdbserver, allowing us attach and debug a running renderer. A process that is not a renderer can also implement the Inspector protocol to support debugging, and this is exactly what Electron’s Node.js process does. The inspector is not enabled by default, but in most cases you only need to pass additional parameters to the application to enable it. For example:
# expose inspector port at 9229 (default port)
app --inspect=9229

# break in the first line of code
app --inspect-brk
After that, you can open chrome://inspect in Chrome and debug the Node.js process.
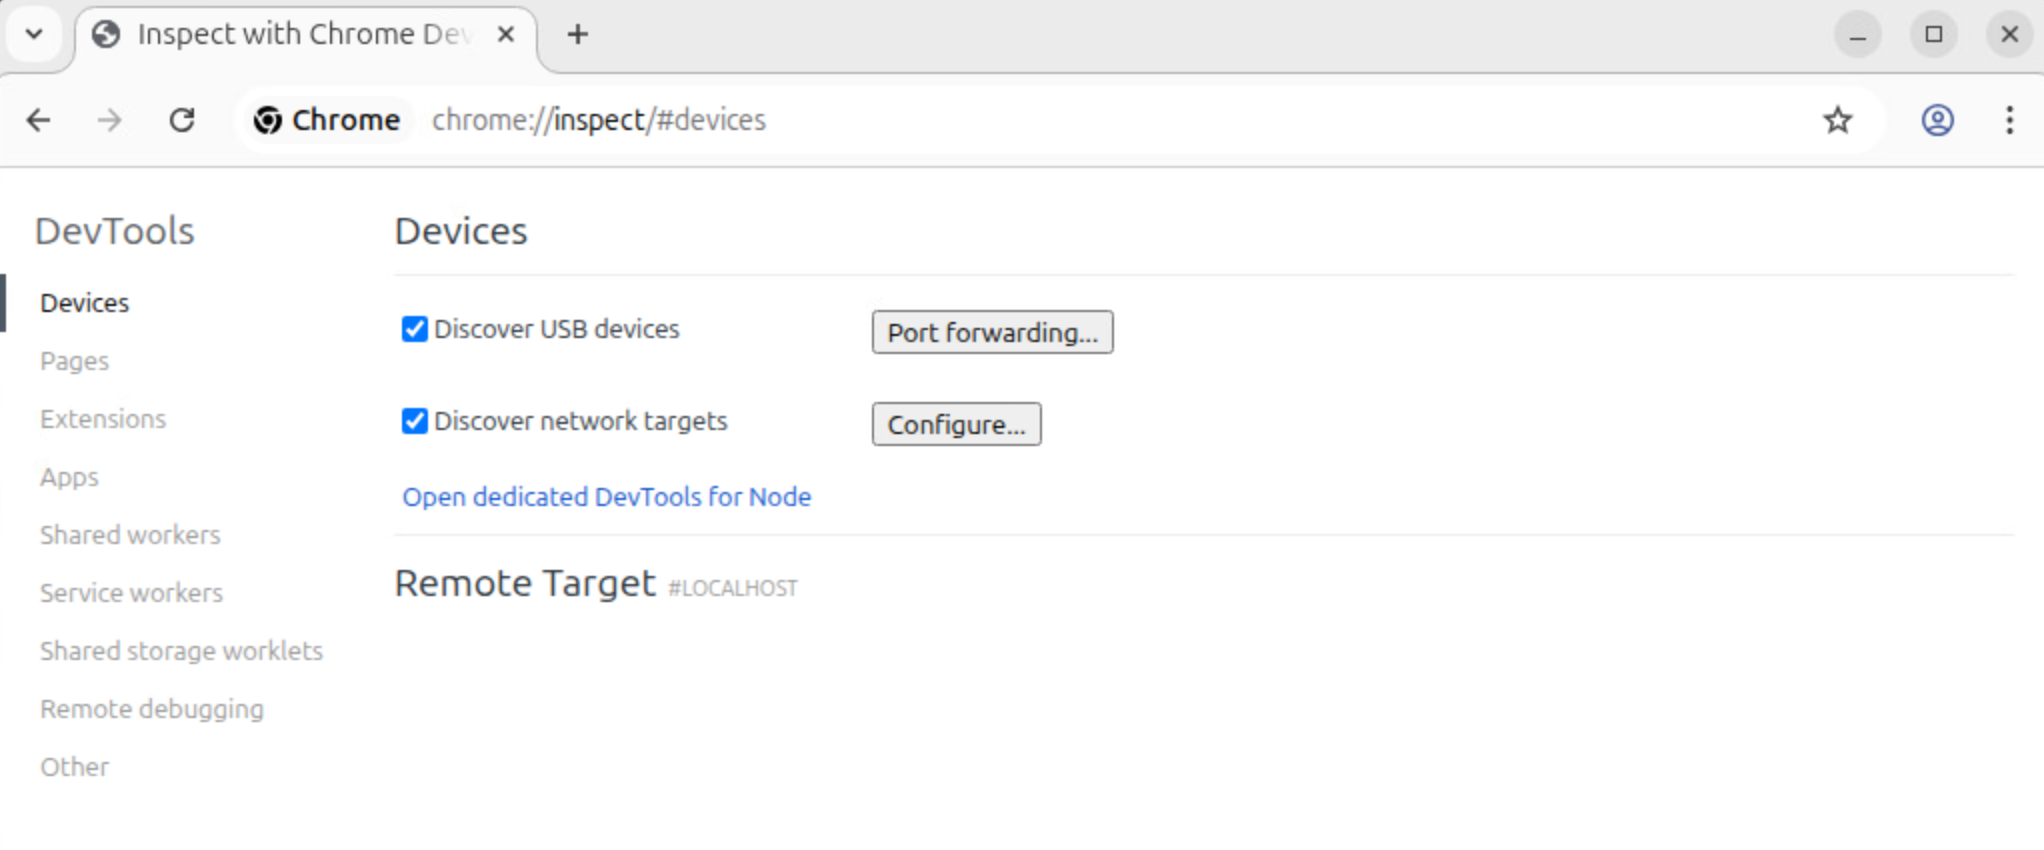
However, when I run obsidian --inspect or similar commands, no inspector is launched. After some investigation, I suspect that Obsidian either modified Node.js code (or perhaps just set some options, not sure) to disable the Inspector.
I then opened my IDA to reverse the Obsidian ELF. By searching for "--inspect", I found that node::options_parser::DebugOptionsParser::DebugOptionsParser() is responsible for parsing debug-related parameters. By mapping the function to the Nodejs source code, it clearly shows that this function parses debug arguments, including --inspect.
DebugOptionsParser::DebugOptionsParser() {
  // [...]
  AddOption("--inspect",
            "activate inspector on host:port (default: 127.0.0.1:9229)",
            &DebugOptions::inspector_enabled, // offset: 9
            kAllowedInEnvvar);
  AddAlias("--inspect=", { "--inspect-port", "--inspect" });
  // [...]
}
But if you set a breakpoint at DebugOptions::CheckOptions() and inspect argv, you will find that --inspect is missing, which means Obsidian does not pass the parameters to Electron at all!
void DebugOptions::CheckOptions(std::vector<std::string>* errors,
                                std::vector<std::string>* argv) {
  // [...]
}
One possible solution is a runtime patch. You can break at node::inspector::Agent::Start(), which determines whether the Inspector should be started. One of the condition check is that the options.inspector_enabled flag must be true. This is the same flag that --inspect is supposed to set. Here, we can simply set it to true manually and then continue execution – the Inspector will start successfully!
bool Agent::Start(const std::string& path,
                  const DebugOptions& options,
                  std::shared_ptr<ExclusiveAccess<HostPort>> host_port,
                  bool is_main) {
  // [...]
  if (!parent_handle_ &&
      (!options.inspector_enabled || !options.allow_attaching_debugger ||
       !StartIoThread())) {
    return false;
  }
  // [...]
}
The following GDB commands are what I used:
b Agent::Start
set follow-fork-mode parent
r
# hit the breakpoint
set *(char *)($rdx + 9)=1
Log out:
...
pwndbg> set *(char *)($rdx + 9)=1
pwndbg> c
Continuing.
[New Thread 0x76bd653f36c0 (LWP 44357)]
Debugger listening on ws://127.0.0.1:9229/6f96cdd8-bb69-4f55-b36f-bfffc2eb2ca8
For help, see: https://nodejs.org/en/docs/inspector
2026-01-18 05:27:15 Loading main app package /opt/Obsidian/resources/obsidian.asar
[New Thread 0x76bcd19ff6c0 (LWP 44358)]
...
Great! We can now debug the main process!
But what if we want to debug the initialization of the main script? Is there any way to pause the Node.js process right at startup? Going back to DebugOptionsParser::DebugOptionsParser(), we can see another parameter, --inspect-brk, which sets the break_first_line flag.
DebugOptionsParser::DebugOptionsParser() {
  // [...]
  AddOption("--inspect-brk",
            "activate inspector on host:port and break at start of user script",
            &DebugOptions::break_first_line, // offset: 12
            kAllowedInEnvvar);
  // [...]
}
The break_first_line flag is used in node::inspector::Agent::WaitForConnectByOptions() to determine whether the Inspector should break at the first line and wait for the debugger to attach.
bool Agent::WaitForConnectByOptions() {
  // [...]
  bool should_break_first_line = debug_options_.should_break_first_line();
  // [...]
  if (wait_for_connect || should_break_first_line) {
    // Patch the debug options to implement waitForDebuggerOnStart for
    // the NodeWorker.enable method.
    if (should_break_first_line) {
      CHECK(!parent_env_->has_serialized_options());
      debug_options_.EnableBreakFirstLine();
      parent_env_->options()->get_debug_options()->EnableBreakFirstLine();
    }
    client_->waitForFrontend();
    return true;
  }
  return false;
}
To enable it, we just need to run one additional GDB command:
set *(char *)($rdx + 12)=1
Now the Inspector will pause execution and wait for us to attach the debugger!
3.2.2. Static Patch
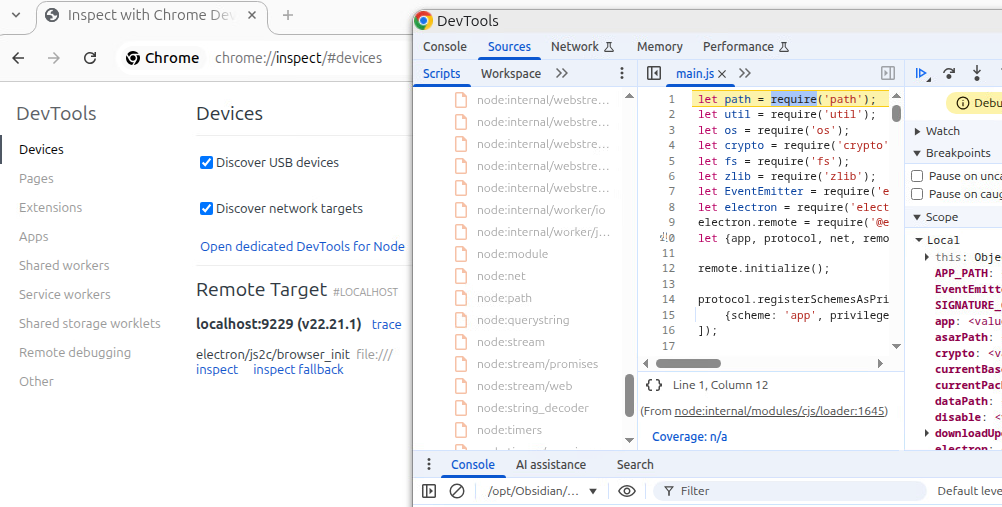
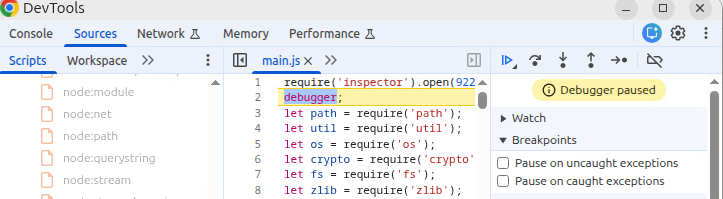
When I was writing this post, I found an easier way to start the Inspector lol. Since we can repack the ASAR file, we just need to add the following two lines of JS code to main.js:
require('inspector').open(9229, '127.0.0.1', true);
debugger;
Repacking ASAR files is straightforward:
cd /opt/Obsidian/resources
npx asar extract app.asar ~/Downloads/app.unpacked
# ... patch file
npx asar pack ~/app.unpacked app.asar
cp app.asar /opt/Obsidian/resources/app.asar
The Inspector will be launched as well.
WOW, I feel like a stupid guy XD
3.3. Find Vulnerabilities
By searching for the string "second-instance" or "open-url", you can easily locate the handler and start analyzing the minified JS code.
// main.js (obsidian.asar)
i.app.whenReady().then(() => {
    // [...]
    i.app.on("second-instance", (e, t) => {
        Ve(t) || Z()
    });
    // [...]
)

/* ...*/ i.app.on("open-url", function(e, t) {
            e.preventDefault(), he(t)
         }), /* ... */
// [...]
In fact, I don’t really have any experience finding protocol handler vulnerabilities, and I didn’t even find any web bugs, so… there are that many things to share in this part :p. However, the protocol handlers have been a widely known attack surface for a long time, and you can find plenty of resources discussing them. For example, Obsidian previously had a potential RCE vulnerability, which happened in the hook-get-address command handler.
If you can execute arbitrary JS code or HTML (via XSS, markdown features, …) in an Electron application, it may lead to unexpected problems. In worst case, an attacker can run call arbitrary Node.js APIs and run system commands. This post explains several scenarios where unsafe Electron configurations can result in pretty bad problems.
There are three relatively important attributes in the Electron webPreferences configuration:
nodeIntegration: whether the renderer process can call Node.js APIs.sandbox: whether the renderer process runs in OS-level sandbox and can only access limited resources.contextIsolation: whether the web page’s JS code is prevented from polluting the global JS environment, such as hijacking preloaded JS code.
I draw a simple map to show where we should focus when looking at an Electron application:
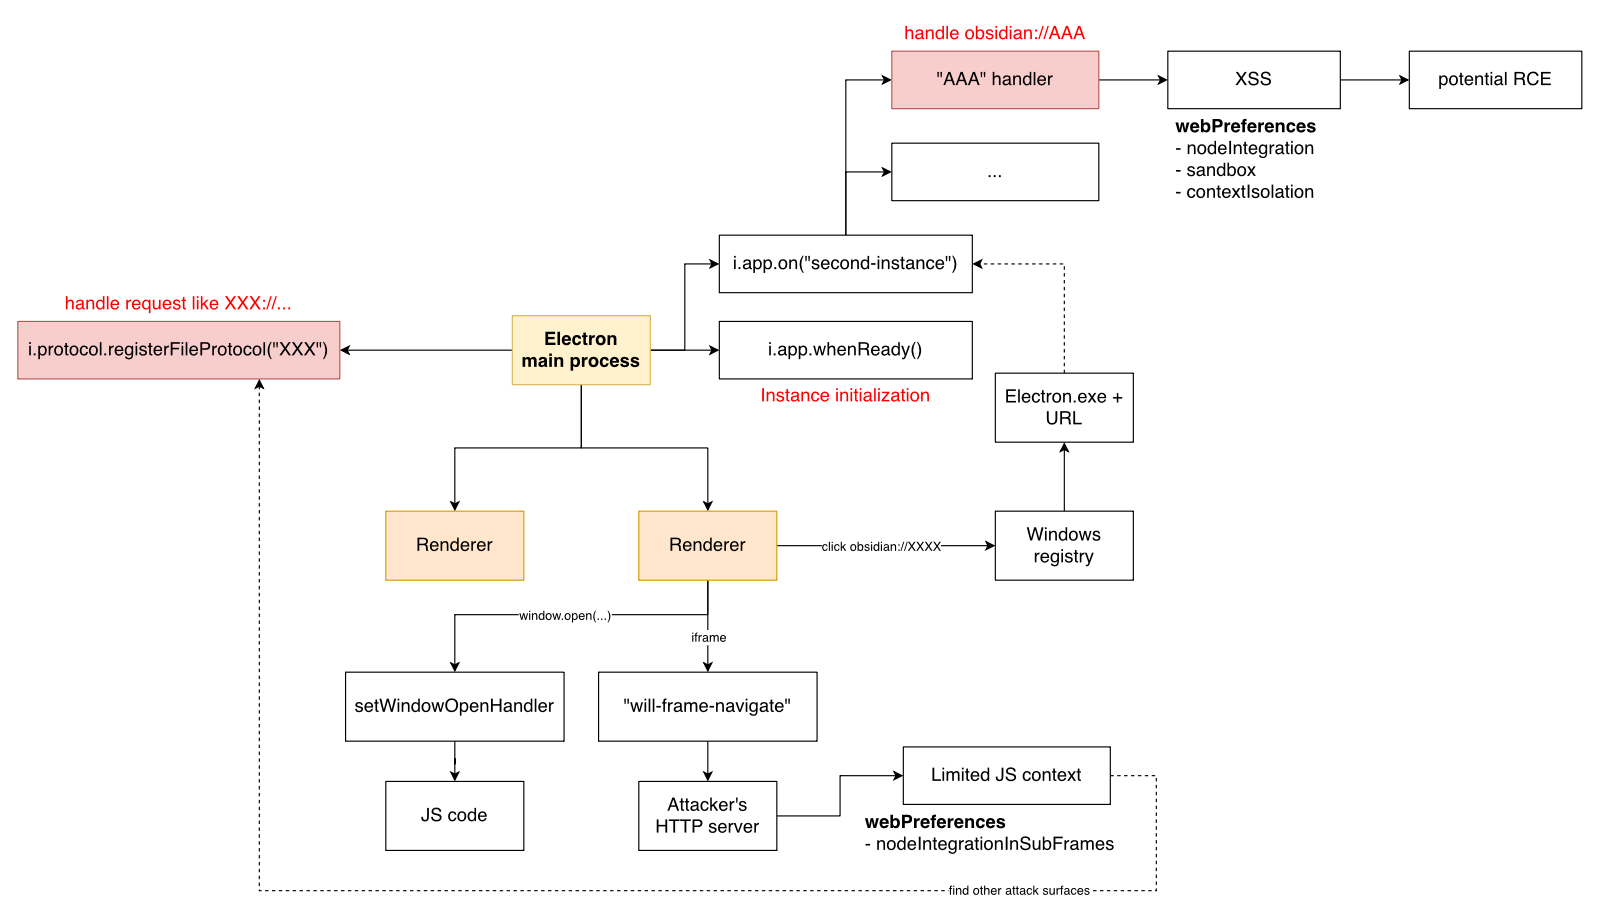
I’m working on it and hope to share somethings interesting in the future!
4. Conclusion
I think writing blogs is still beneficial, not only for sharing technical ideas, but also for organizing what I’ve learned. Hope I can keep doing this throughout the year!